
Hi everyone. It has probably happened to you: concert tickets go on sale, a big shopping event starts, course registration opens at university or a filing deadline arrives, and the site that always worked fine suddenly takes forever, throws errors or doesn't load at all. The application worked. What it wasn't ready for was that many people at the same time.
That's the territory of performance testing: checking not only that the system does what it should, but that it does it quickly, reliably and with the number of users it will actually have. Within it, stress testing lets us go further and find out where the limit is, what breaks first and how the system recovers when we push it beyond what's expected.
In this article I'll cover everything you need to get started: what performance testing is, which types exist (load, stress, spike, soak and more), which metrics to look at and how to interpret them, how to plan and run a test step by step, which tools are most widely used, with code examples, how to find bottlenecks and how to bring all of this into the pipeline. At the end I'll leave you a path to start practicing.
What is performance testing?
Performance testing is a set of non-functional tests that evaluate how a system behaves under a given workload. It doesn't ask "does this work?", but "how well does it work when many people use it at once, for a long time or with large volumes of data?".
Specifically, it measures aspects such as:
- Speed: how long the system takes to respond.
- Capacity: how many users or transactions it can handle.
- Stability: whether it keeps behaving the same over time or degrades.
- Scalability: whether adding resources lets it handle proportionally more load.
- Resource usage: how much CPU, memory, disk and network it consumes to do its job.
A common mistake is to think "performance" is a single type of test. It's actually a family: load, stress, spike and soak tests are all performance tests, but each one answers a different question. Choosing the right one depends on what you want to find out.
In the ISTQB framework, performance efficiency is one of the quality characteristics of the ISO/IEC 25010 model, and there's a dedicated certification, the Certified Tester Performance Testing (CT-PT). If you're interested, QARMY has ISTQB study material and a CT-PT exam simulator to practice with.
Why performance testing matters
It's easy to underestimate performance while everything runs fine in the development environment, with a single user and an almost empty database. But conditions are different in production, and performance problems have very concrete consequences:
- Users who leave. People's patience is short. A page that takes several seconds to load loses visitors, and a slow checkout loses sales. Users don't distinguish between "slow" and "broken": they simply leave.
- Outages at the worst moments. Performance problems show up exactly when traffic is highest: a launch, a campaign, the end of the month, a deadline. In other words, when an outage costs the most.
- Infrastructure costs. An inefficient system needs more servers to serve the same number of users. In the cloud, you pay for that every month.
- Reputation. An outage during an important event gets talked about on social media and can hurt a brand's image for a long time.
- Problems that are hard to fix late. Many performance problems come from architecture decisions. Discovering them a week before going live is far more expensive than catching them early, which ties directly to the Shift-Left approach.
So, as QAs, it isn't enough to validate that a feature "works". We also have to ask: how many users do we expect? How fast does it have to respond? What happens on the busiest day of the year? Those questions are the starting point of any performance strategy.
Types of performance testing
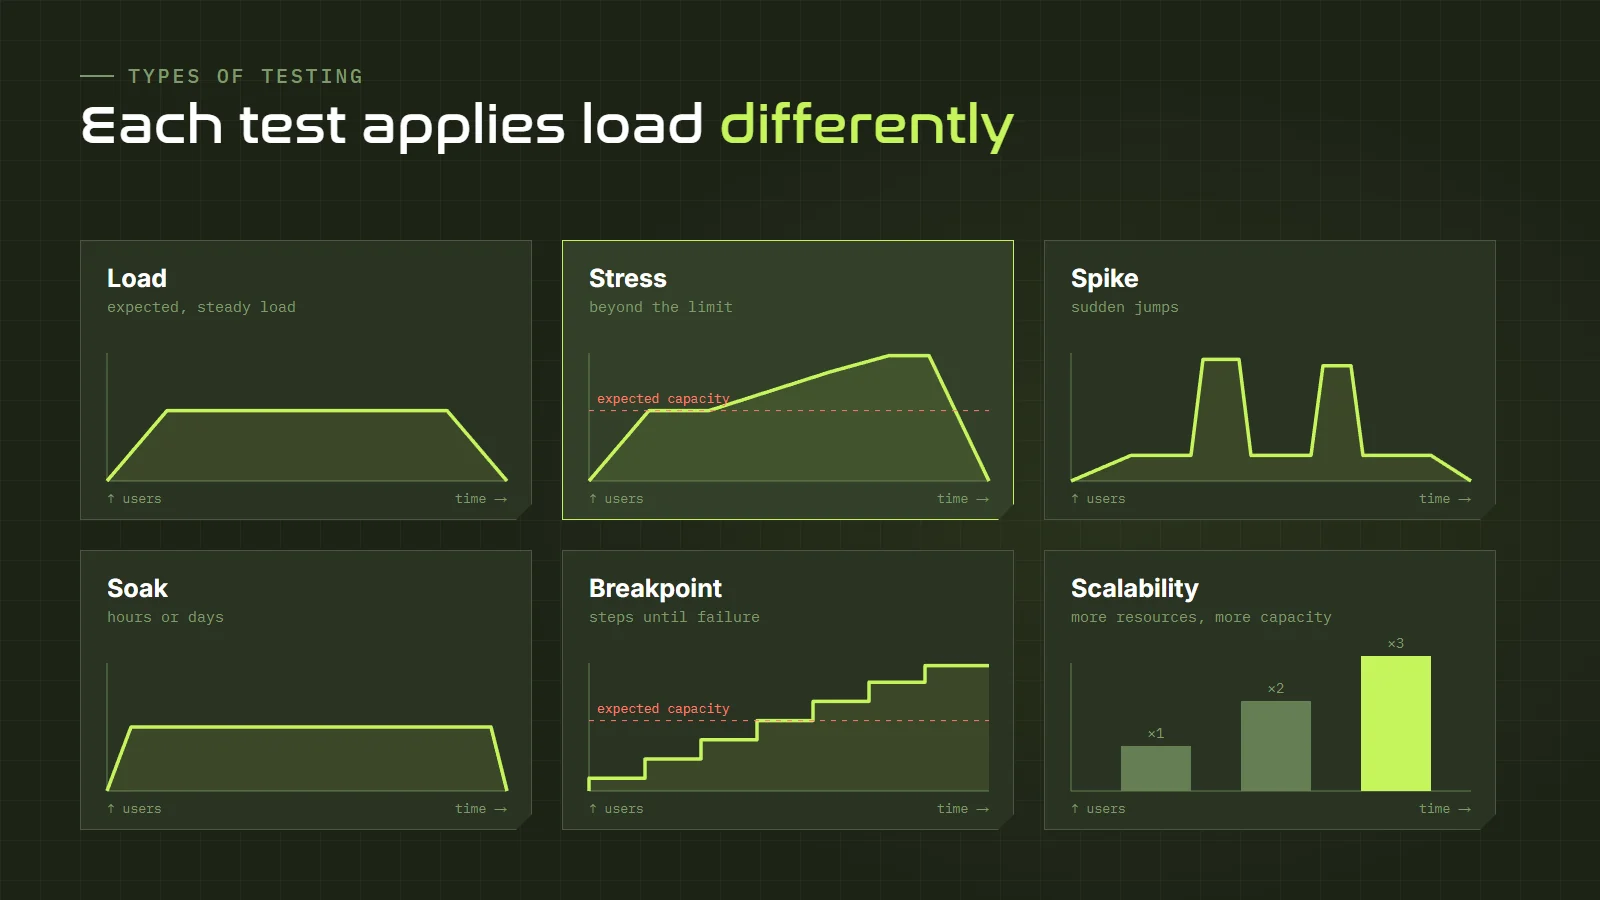
Each type of test applies load in a different way to answer a different question. The easiest way to understand them is to look at how the number of users changes over time:
Load testing
The most common one. It simulates the expected number of users under normal or usual peak conditions and checks that the system meets its performance goals. The load increases gradually (the ramp-up), stays steady for a while and then goes down.
Answers: does the system handle the load we expect with acceptable response times?
Stress testing
Pushes the system beyond its expected capacity, increasing the load until it starts to degrade or fail. The goal isn't for the system to "hold up", but to understand how it fails: which component saturates first, which errors appear, whether it fails gracefully (for example, rejecting requests with a clear message) or catastrophically, and whether it recovers on its own when the load goes down.
Answers: where is the limit, what breaks first and how does the system recover?
Spike testing
Applies sudden, extreme increases in load over a very short time and then drops them abruptly. It simulates situations such as a ticket sale opening, a push notification sent to every user at once or a link going viral.
Answers: does the system react well to a sharp jump in traffic? Does autoscaling kick in in time?
Soak or endurance testing
Keeps a normal or moderate load for a long period: several hours or even days. Many problems don't appear in a twenty-minute test: memory leaks, connections that aren't released, log files filling up the disk, caches growing out of control or scheduled jobs interfering.
Answers: does the system stay stable over time or slowly degrade?
Breakpoint or capacity testing
Increases the load continuously, in steps, until the system stops meeting its performance goals. It's similar to stress testing, but the focus is on finding the exact number of users or transactions per second the system can handle. It's very useful for capacity planning.
Answers: what is the maximum load the system supports while meeting its goals?
Scalability testing
Evaluates how the system's capacity changes when resources are added: more servers, more CPU, more memory. In a well-designed system, doubling the servers should come close to doubling capacity. If it doesn't, something isn't scaling, for example a shared database that becomes the bottleneck.
Answers: does adding resources increase capacity proportionally?
Volume testing
Instead of many users, it tests the system with large volumes of data: a database with millions of records, a huge file to import, a report that processes years of information. A query that's instant with a thousand records can take minutes with ten million.
Answers: does the system keep its performance as the amount of data grows?
Which one should you run?
If you're just starting, begin with a load test at the expected load: it gives the most useful information for the least effort. Then add a stress test to learn the limits, and a soak test before important releases. Spike tests are essential if your business has events with concentrated traffic.
Metrics you need to know
Running a performance test is relatively easy. The hard part, and the one that adds the most value, is interpreting the results. For that you need to understand what each metric measures and which ones really matter.
Response time
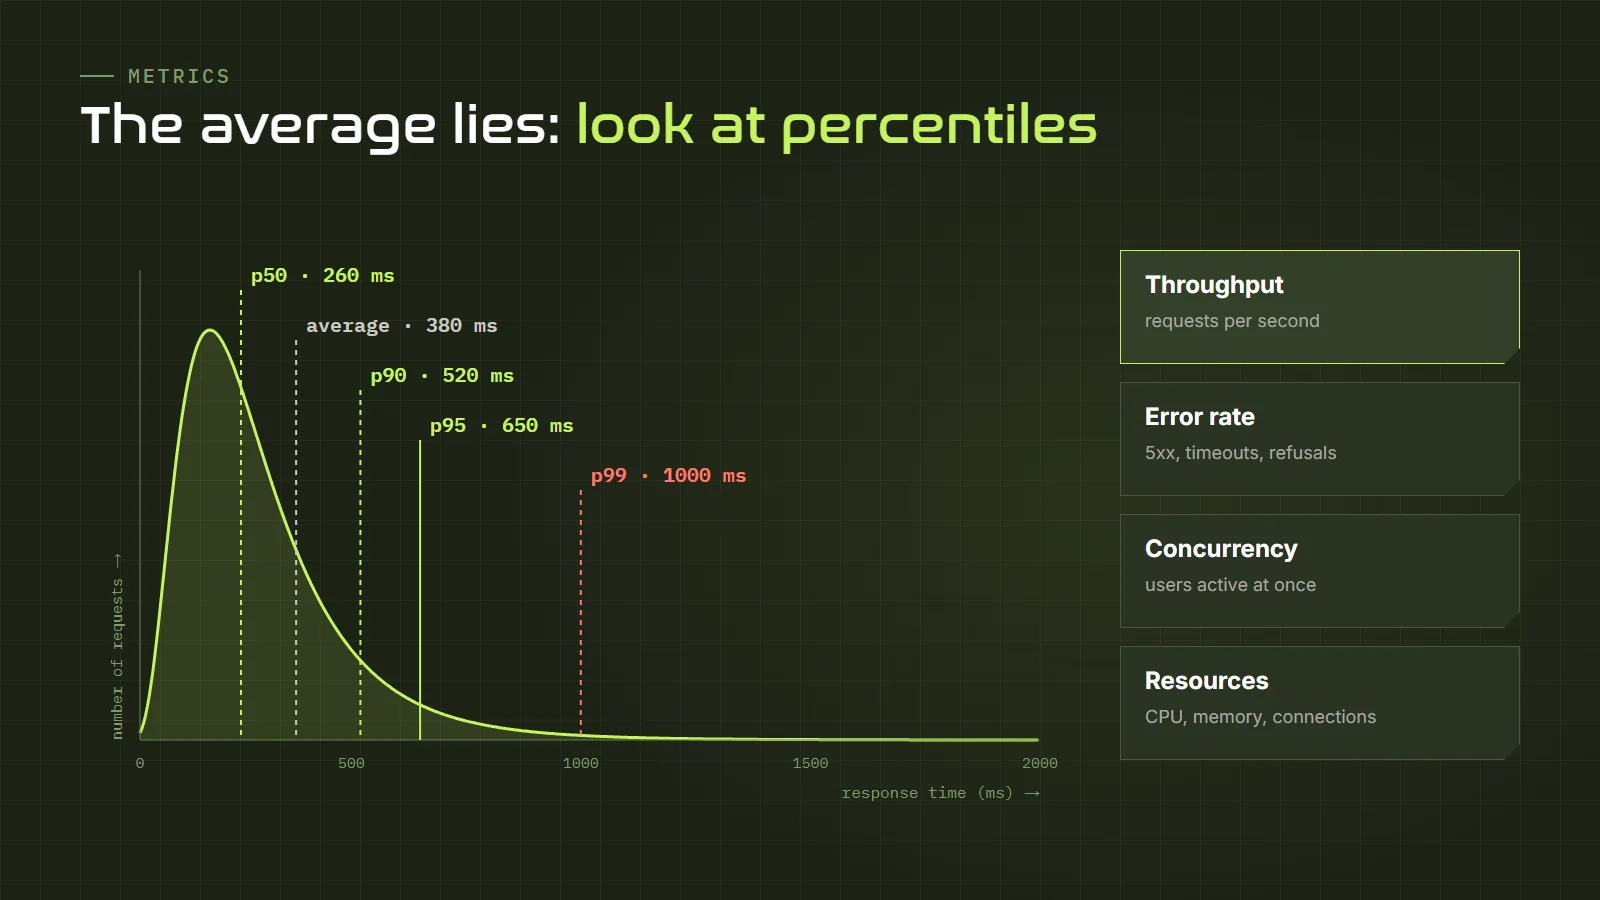
The time from when a request is sent until the full response is received. It's the metric most visible to users. But be careful how you summarize it: the average is misleading. If nine requests take 100 milliseconds and one takes ten seconds, the average comes out at about one second, a number that doesn't describe any of the actual requests.
That's why performance testing uses percentiles:
- p50 (median): half of the requests took less than this value. It represents the typical experience.
- p90 and p95: 90% or 95% of the requests took less than this value. They're the most common for setting goals.
- p99: 99% took less. It shows the "tail" of the distribution: the users with the worst experience.
It may seem that p99 affects only a few people, but think of a page that makes twenty calls to the server: the chance that at least one lands in that slowest 1% is high. That's why, in high-traffic systems, the tail matters a lot.
Throughput
The amount of work the system processes per unit of time: requests per second, transactions per minute, messages per second. It's the measure of capacity. A classic sign of saturation is that, as users increase, throughput stops growing while response time shoots up.
Error rate
The percentage of requests that fail: server errors (5xx codes), timeouts, refused connections, incorrect responses. A system that responds very quickly but with 10% errors isn't working well. If you need a refresher on what each code means, see our HTTP status code reference.
Concurrent users and virtual users
Virtual users are the users simulated by the testing tool. Concurrent users are the ones active at the same time. Careful: a thousand concurrent users doesn't mean a thousand requests per second, because real users read, think and fill in forms between one action and the next.
Resource usage
CPU, memory, disk, network, database connections, threads, queue sizes. The load tool doesn't give you these server-side metrics: you have to get them from monitoring. They're the ones that explain why the system behaves the way it does.
Apdex and other indicators
Some tools use the Apdex index, which summarizes user satisfaction as a number from 0 to 1 based on a response time threshold. It's useful for executive reports, but for analyzing problems it's better to go to the percentiles.
Key concepts before you start
Performance goals (SLA, SLO and SLI)
A performance test without goals is just an experiment. Before running anything, you need to agree on what's "acceptable". The industry uses three acronyms:
- SLI (indicator): the metric being measured, for example the p95 response time of the login.
- SLO (objective): the target value, for example "login p95 must be under 800 ms".
- SLA (agreement): the formal commitment to customers, with consequences if it isn't met.
A good performance goal is measurable and specific: "with 500 concurrent users, search p95 must be under one second and the error rate under 1%". "It should be fast" is not a goal.
Ramp-up, steady state and ramp-down
Almost every test has three phases: the ramp-up, where users are added gradually; the steady state, where the load is held and the main measurements are taken; and the ramp-down, where the load decreases. Starting with all users at once (except in a spike test) distorts the results.
Think time and pacing
Think time is the pause a real user takes between actions: reading a page, choosing a product, filling in a form. If your script doesn't include these pauses, each virtual user generates far more load than a real one, and the results don't represent reality. Pacing controls how often a virtual user repeats the whole scenario.
Open and closed models
In a closed model there's a fixed number of users: each one waits for the response before continuing. If the system gets slow, users generate fewer requests and the load drops on its own. In an open model requests arrive at a fixed rate, regardless of whether the system responds quickly or slowly, just like real internet traffic. The open model is more realistic for public sites and better at detecting saturation. Tools such as k6 and Gatling let you choose between them.
Correlation and parameterization
Parameterization means each virtual user uses different data (users, products, searches) instead of always repeating the same values. If everyone searches for the same thing, the cache answers everything and the results are misleadingly good. Correlation means capturing dynamic values from a response (a session token, an order ID) to use them in the following requests, just like a real browser does.
How to plan and run a test
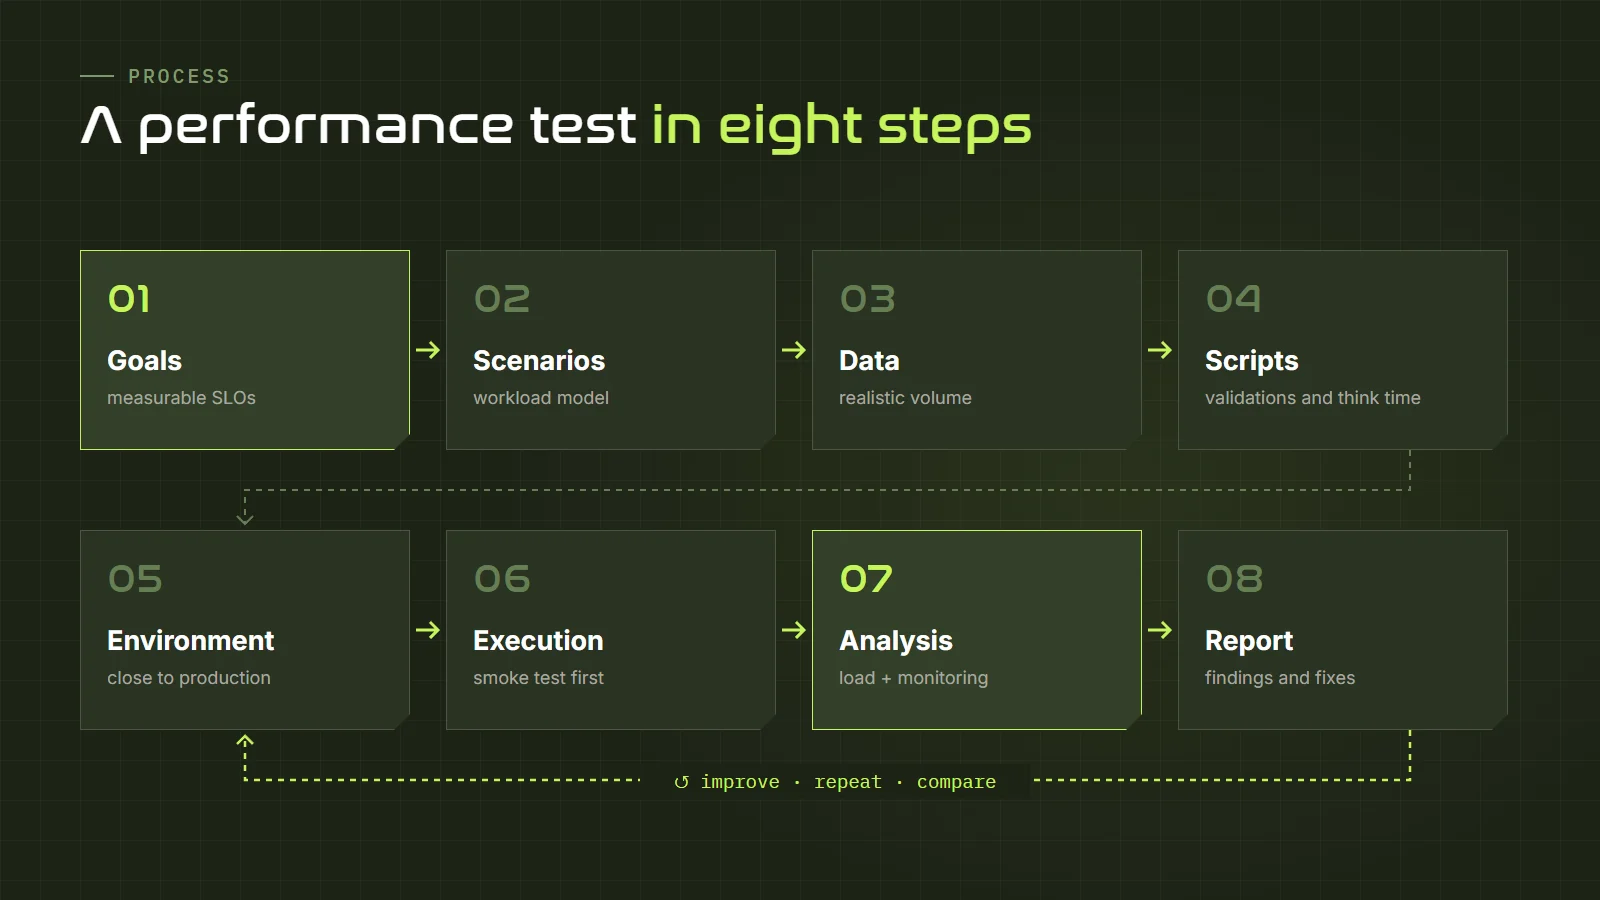
A well-run performance test follows a process that goes far beyond "running the tool". This is the path I recommend:
1. Define goals
Talk to the business, product and development teams. How many users are expected on a normal day and at peak? Which transactions are critical? What response times are acceptable? Are there special events on the horizon? If the system is already in production, analytics data and logs are the best source for answering these questions.
2. Design the scenarios
Identify the most used flows and the most business-critical ones, and build a workload model: what percentage of users does each thing. For example, in an online store: 60% browse the catalog, 25% search for products, 10% add to cart and 5% complete a purchase. A scenario where everyone buys at the same time doesn't represent reality.
3. Prepare the data
You need enough realistic data: test users, products, accounts with balance. And the environment's database needs a volume similar to production. Testing with an almost empty database is one of the most frequent causes of optimistic results that don't hold later.
4. Write the scripts
Turn the scenarios into scripts in the chosen tool, with parameterization, correlation, think time and validations: receiving a response isn't enough, you have to check it's the correct one. A server that quickly returns an error page isn't passing the test.
5. Prepare the environment
The test environment should resemble production as closely as possible in architecture, configuration and resources. If it's smaller, take that into account when interpreting results. Also make sure the load generators have enough resources: if the machine generating the load runs out of CPU, the bottleneck is your tool, not the system. And of course, warn the infrastructure team before running: an unannounced stress test can look like an attack.
6. Run
Start with a smoke test with few users to validate that the scripts work. Then run the planned tests while monitoring the system in real time. Repeat the tests more than once: a single result can be affected by external factors.
7. Analyze
Cross-reference the tool's results (times, throughput, errors) with server monitoring (CPU, memory, database). Look for the moment performance started to degrade and what was happening at that instant. That's usually where the cause is.
8. Report and improve
Write a clear report: goals, scenarios, results against goals, findings, identified bottlenecks and recommendations. After each improvement, run the test again to compare. Performance is a cycle, not an event. If you want to document all this within a broader strategy, you can start from our test plan template.
Performance testing tools
There are many tools, free and commercial, and each has its own approach. These are the most widely used in the industry:
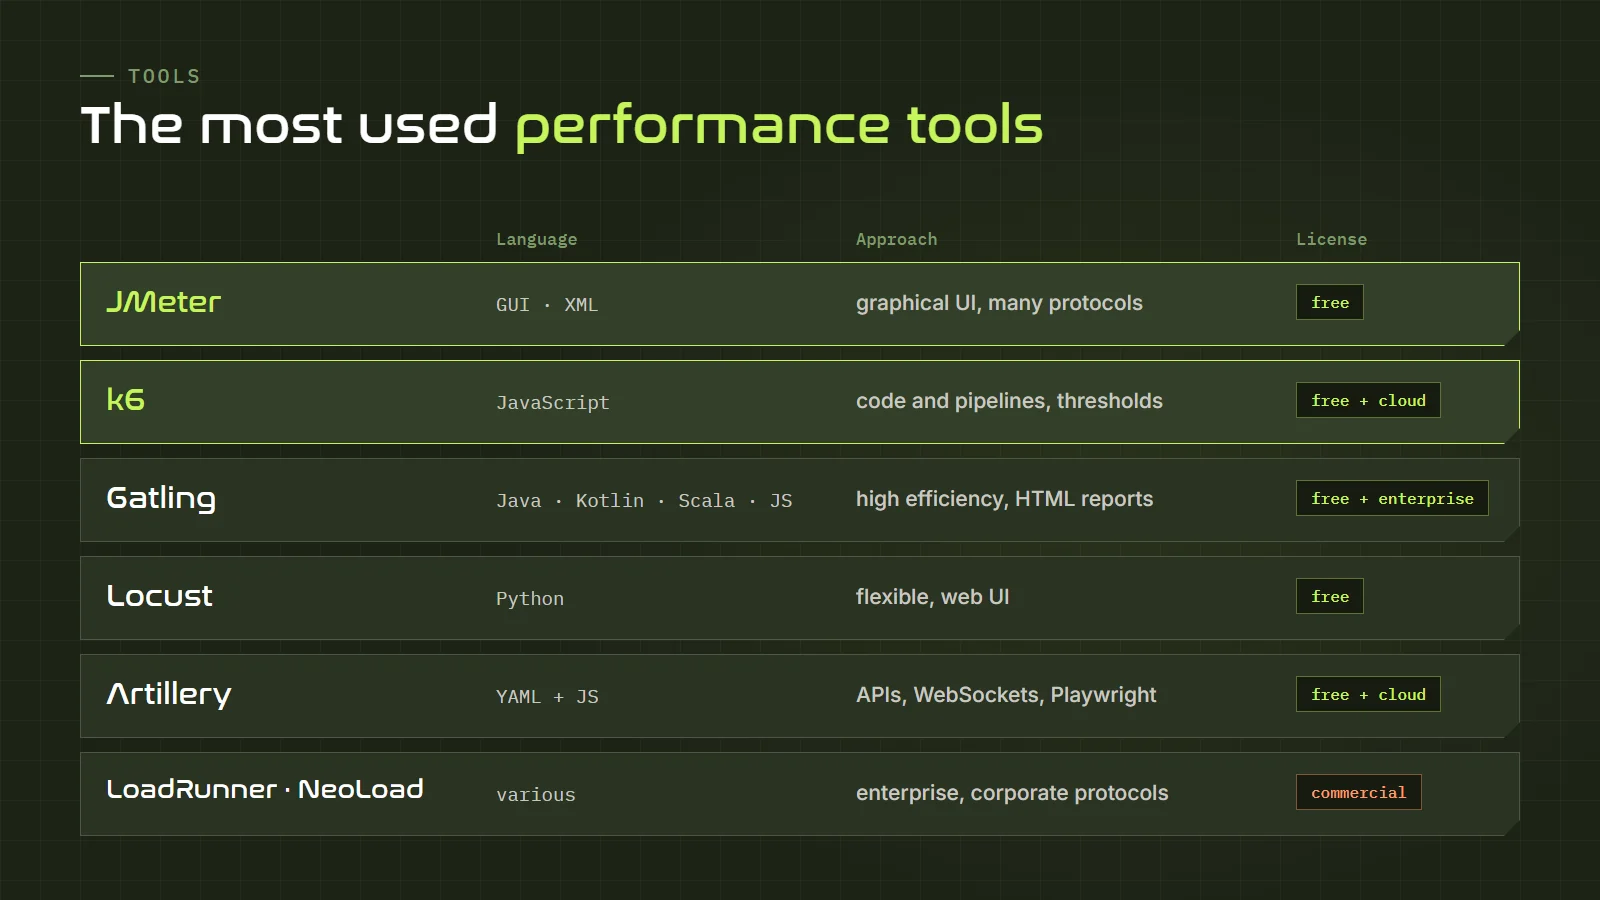
Apache JMeter
The best-known performance tool and one of the oldest. It's free, open source, written in Java and has a graphical interface for building test plans without coding. It supports a huge number of protocols (HTTP, databases via JDBC, JMS, FTP, LDAP and more) and has an enormous plugin ecosystem.
Pros: huge community, lots of documentation, versatility and high demand in job postings. Cons: the interface feels dated, plans are stored as XML (hard to review in a repository) and it uses quite a lot of resources per virtual user. An important tip: the GUI is for designing and debugging; real tests are run from the command line.
Grafana k6
An open-source tool, now part of Grafana Labs, where scripts are written in JavaScript. It's designed for teams that work with code and pipelines: scripts live in the repository, get reviewed like any other code and integrate easily with CI/CD. It's very resource-efficient and lets you define thresholds that fail the test if the goals aren't met.
Pros: modern, lightweight, easy to learn if you know some JavaScript, excellent Grafana integration. Cons: no GUI for building tests (although it has a browser recorder) and fewer protocols supported natively than JMeter, although extensions exist.
Gatling
An open-source tool with a commercial edition, where simulations are written as code in Java, Kotlin, Scala and also JavaScript. It's very efficient, thanks to an asynchronous architecture that simulates many users with few resources, and it generates very complete, clear HTML reports.
Pros: performance, reports, a good load injection model (open and closed). Cons: a steeper learning curve if you don't come from the Java or Scala world.
Locust
An open-source tool where users are defined in Python. Its big advantage is flexibility: since behavior is plain Python code, you can model almost anything. It has a web interface for launching tests and viewing results in real time, and it can be distributed across several machines.
Pros: ideal for teams that already use Python, very flexible and easy to read. Cons: on a single machine it generates less load than tools such as k6 or Gatling, although distributing it makes up for that.
Artillery
A Node.js-based tool where tests are defined in YAML, with the option to add logic in JavaScript. It's very convenient for APIs, WebSockets and real-time applications, and it can integrate with Playwright for load testing with real browsers.
Commercial tools: LoadRunner and NeoLoad
OpenText LoadRunner (formerly Micro Focus and HP) is one of the historic tools of the enterprise market, supporting a huge number of protocols and technologies, including corporate applications such as SAP or Citrix. Tricentis NeoLoad is another enterprise option, with a more modern approach and strong pipeline integration. Both have paid licenses and are seen mostly in large organizations, banks and regulated industries.
Cloud platforms
To generate a lot of load from different regions without managing servers, there are services such as Grafana Cloud k6, BlazeMeter (which runs JMeter, Gatling and other scripts), Azure Load Testing or Gatling Enterprise. They're useful when the load you need exceeds what you can generate with your own machines.
Quick command-line tools
For a quick measurement of an endpoint without writing a full scenario, there are tools such as ApacheBench (ab), wrk, hey or oha. They're good for a first idea or for comparing two configurations, but they don't replace a test with realistic scenarios.
What about Postman?
Postman added a performance testing feature that simulates several virtual users over a collection. It's a good entry point if you already work with Postman for API testing, although for serious load or stress testing a specialized tool is a better fit.
Which one should you choose?
| If your situation is… | Look at |
|---|---|
| You're just starting and don't code | JMeter, for its GUI and the amount of learning material available. |
| Your team works with JavaScript and pipelines | k6 or Artillery. |
| Your team works with Java, Kotlin or Scala | Gatling. |
| Your team works with Python | Locust. |
| You need unusual protocols or corporate applications | JMeter, LoadRunner or NeoLoad. |
| You need very large load from several regions | A cloud platform. |
More important than the tool is judgment: a poorly designed script gives useless results in any tool. Pick the one that best fits your team and go deep with it.
Script examples
To show what a test looks like in practice, here are two simple examples of a load test against a products API.
k6 example
This script gradually ramps up to 50 virtual users, holds them for five minutes and ramps down. It defines thresholds: if p95 exceeds 800 ms or errors exceed 1%, the test fails.
import http from 'k6/http';
import { check, sleep } from 'k6';

export const options = {
  stages: [
    { duration: '2m', target: 50 },  // ramp-up
    { duration: '5m', target: 50 },  // steady state
    { duration: '1m', target: 0 },   // ramp-down
  ],
  thresholds: {
    http_req_duration: ['p(95)<800'], // p95 under 800 ms
    http_req_failed: ['rate<0.01'],   // under 1% errors
  },
};

export default function () {
  const res = http.get('https://api.example.com/products?page=1');
  check(res, {
    'status 200': (r) => r.status === 200,
    'returns products': (r) => r.json('items').length > 0,
  });
  sleep(Math.random() * 3 + 1); // think time of 1 to 4 seconds
}
You run it with k6 run products-load.js, and when it finishes it shows a summary with percentiles, throughput, errors and whether the thresholds were met.
Locust example
The same scenario in Locust, with a user who browses products more often than they view a product's details:
from locust import HttpUser, task, between

class Shopper(HttpUser):
    wait_time = between(1, 4)  # think time

    @task(3)  # three times more frequent
    def list_products(self):
        self.client.get("/products?page=1")

    @task(1)
    def view_product(self):
        with self.client.get("/products/42", catch_response=True) as r:
            if "price" not in r.text:
                r.failure("response without price")
You run it with locust -f locustfile.py --host https://api.example.com and control it from the web interface it opens in the browser.
Notice that both examples include response validations and think time. Without those two things, the test measures something, just not what you care about. And never run load tests against systems you don't own or without authorization: besides being bad practice, it can be considered an attack.
Monitoring and observability
The load tool tells you what happened: times went up, errors appeared. Monitoring tells you why. A performance test without server-side monitoring is like a medical checkup that only takes your temperature.
These are the usual pieces:
- Infrastructure metrics: CPU, memory, disk and network for each server or container. Prometheus with Grafana is the most popular open-source combination; in the cloud, each provider has its own service.
- APM (application performance monitoring): tools such as Datadog, New Relic, Dynatrace, Elastic APM or solutions based on OpenTelemetry show how long each part of the code, each database query and each call to another service takes.
- Distributed tracing: in microservice architectures, it lets you follow a request through every service it touches and see where the time goes.
- Database metrics: slow queries, locks, connection pool usage, unused indexes.
- Logs: errors and exceptions during the test, which often explain failure spikes.
A practical tip: build a dashboard that shows the load tool's results and the server metrics on the same timeline. k6, JMeter and Gatling can send their results to systems such as InfluxDB or Prometheus so you can see them in Grafana alongside everything else. Seeing on the same chart that response time spiked exactly when the database CPU hit 100% is worth more than any report.
How to find bottlenecks
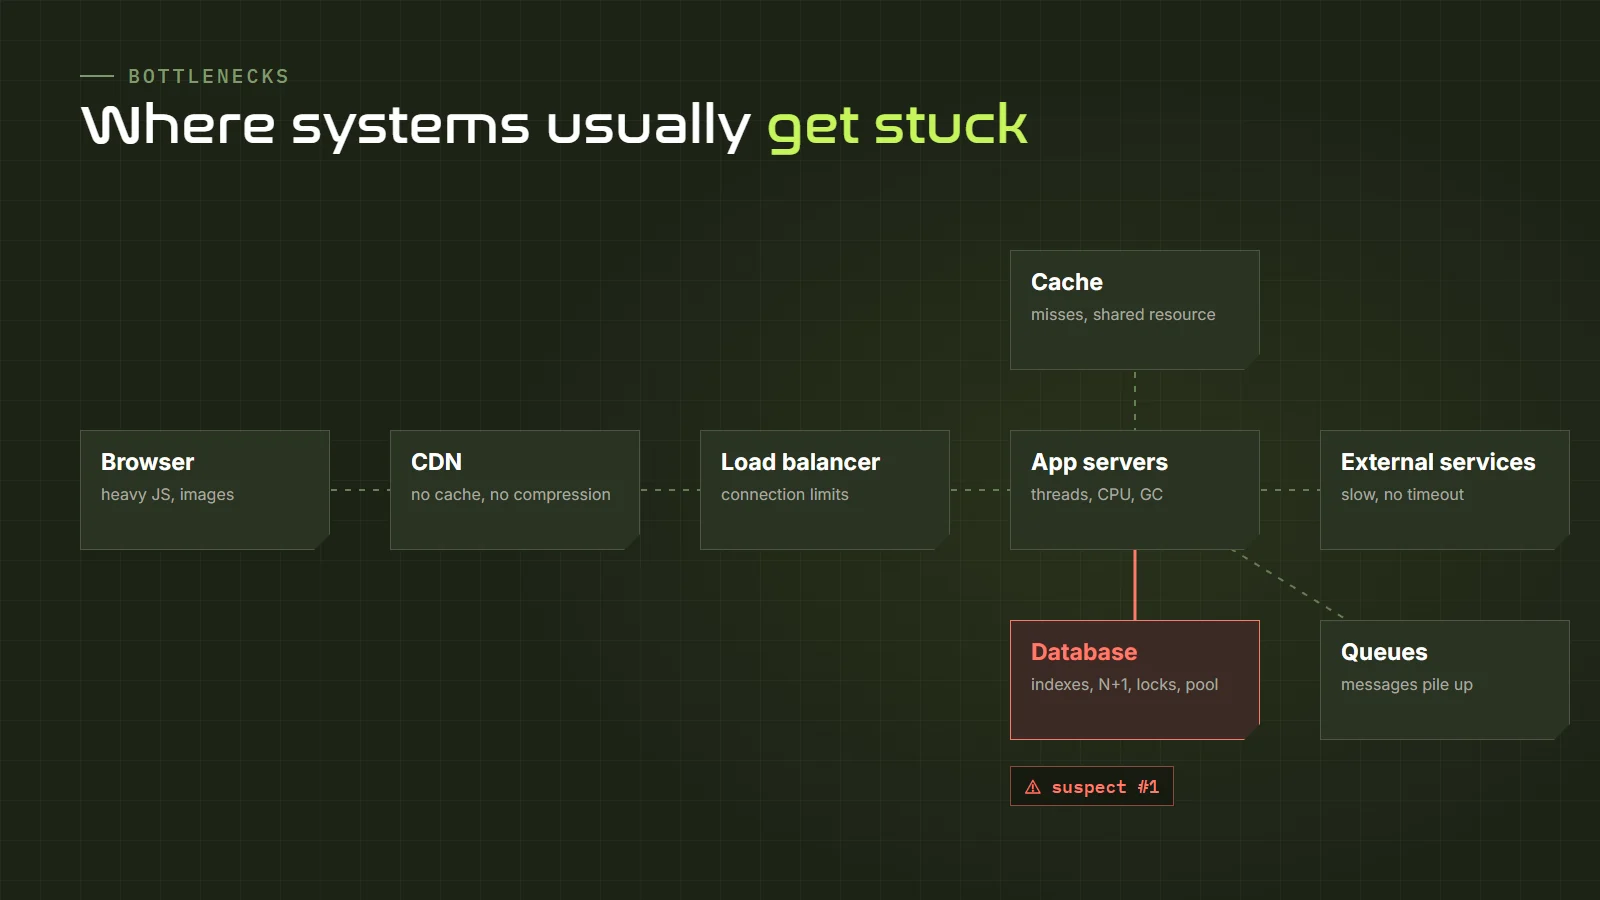
A bottleneck is the component that limits the capacity of the whole system. There's always one: the job is to find it, decide whether its limit is acceptable and, if not, fix it. And when you fix one, the next one shows up.
The curve you need to know how to read
If you plot throughput and response time as users increase, you'll almost always see the same pattern. At first, more users mean more throughput and response time stays steady. At some point throughput stops growing: the system has reached its capacity. From there on, adding users only makes requests wait in a queue, and response time grows very quickly. If you keep pushing, errors appear and throughput may even fall.
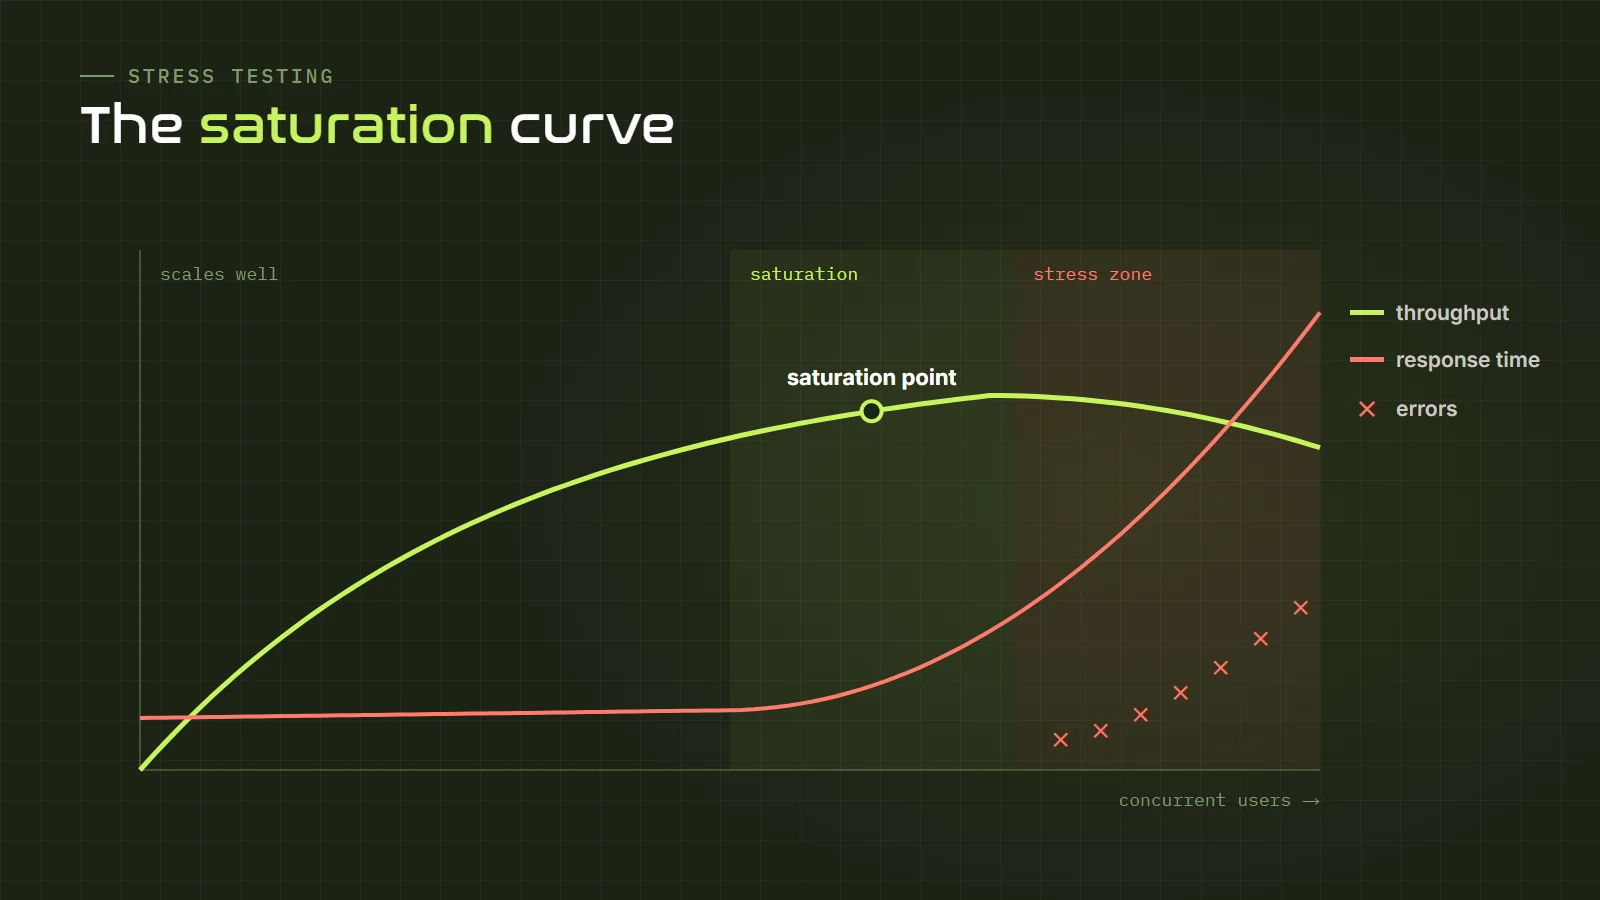
The point where the curve "bends" is the most valuable piece of data from a stress test: it tells you the system's real capacity in its current configuration.
Frequent bottlenecks
- Database: suspect number one. Queries without indexes, queries that fetch far more data than needed, the "N+1 queries" problem (one query per item in a list), locks between transactions and connection pools that are too small.
- Inefficient code: algorithms that don't scale, unnecessary processing on every request, heavy serialization or no caching for data that rarely changes.
- External services: a payments or third-party API that responds slowly drags the whole system down. Reasonable timeouts are key; never wait indefinitely.
- Configuration: thread, connection or memory limits left at default values that don't match the real load.
- Garbage collection: in languages such as Java or .NET, long garbage collector pauses can cause latency spikes.
- Network and static files: heavy images, uncompressed files and no CDN.
- Shared resources: a cache, queue or file system that every server uses and that doesn't scale with them.
One way to investigate
When you find a degradation, follow this order: identify which transaction degrades, find when it started and at what load, check which resource was saturated at that moment, and drill down with the APM or logs to find the specific cause. Then, once the fix is applied, repeat the same test under the same conditions to confirm the result. Without that comparison, you don't know whether you improved anything.
Performance on the browser side
Everything above focuses on the server, but users also perceive speed in their browser or phone. An API can respond in 100 milliseconds and the page can still take five seconds to become usable because of heavy images, too much JavaScript or render-blocking resources.
Google defined the Core Web Vitals, metrics that measure the real loading experience:
- LCP (Largest Contentful Paint): how long the main content of the page takes to appear.
- INP (Interaction to Next Paint): how quickly the page responds when the user interacts.
- CLS (Cumulative Layout Shift): how much the content "moves around" while loading.
To measure them you can use Lighthouse (built into Chrome's developer tools), PageSpeed Insights and WebPageTest, which also let you simulate devices and slow networks. If you test mobile apps, on-device performance is a whole topic of its own: we cover it in our mobile device testing guide.
A complete strategy combines both views: load tests to know how much the server can take, and frontend tests to know what the user experiences.
Performance in the pipeline
Traditionally, performance tests were run once, shortly before going live. The problem is that if an architecture problem shows up at that point, it's already too late. Today the trend is to bring performance in continuously:
- Short tests on every change: a small load test of a few minutes that runs in the pipeline and fails if thresholds are exceeded. It doesn't replace a full test, but it catches performance regressions early. k6, Gatling and JMeter integrate easily with GitHub Actions, GitLab CI or Jenkins.
- Comparison against a baseline: store the results of each run and compare with the previous one. A 30% increase in an endpoint's p95 after a change is a clear signal.
- Periodic full tests: scheduled load, stress and soak tests, for example every week or before each major release.
- Production monitoring: real performance is measured with real users. Production monitoring is the Shift-Right side of performance.
If you already work with automation, the k0lmena framework includes support for performance testing alongside functional and API tests, so you can keep everything in one project.
Common performance testing mistakes
- Testing without goals. Without acceptance criteria, there's no way to know whether a result is good or bad.
- Looking only at the average. It hides problems. Use percentiles.
- Not using think time. It generates unrealistic load and wrong conclusions.
- Always using the same data. The cache makes everything look fast.
- Testing with an empty database. Volume problems only appear with volume.
- Not validating responses. An error that comes back fast isn't a success.
- Saturating the load generator. If the machine generating load is at its limit, you're measuring your tool.
- Testing against real third-party services. A payment gateway or external service isn't yours to stress. Use mocks or environments provided by the vendor.
- Running only once. Results vary. Repeat and compare.
- Leaving it until the end. Architecture problems found a week before launch are rarely fixed in time.
- Not looking at the server. Without monitoring you know something is wrong, but not why.
How to start practicing
If you want to get into performance testing, here's a path:
- Strengthen the fundamentals. Understand how HTTP works, what an API is, what status codes mean and how a request travels from the browser to the database. Our guides on Swagger and Postman are a good start, and if you're starting from scratch, our free QA course gives you the foundation.
- Pick a tool and learn it well. JMeter if you prefer a GUI; k6 if you're comfortable with a bit of code.
- Build your own lab. Run a sample application on your computer (there are plenty in Docker) and test against it. That way you can push it to the limit without risk. In our list of websites to practice testing you'll also find APIs built for practice, but remember to respect their terms of use: many don't allow load testing.
- Add monitoring. Install Grafana and Prometheus or InfluxDB and learn to view results and server metrics together.
- Practice analysis. Deliberately introduce a problem into your test application (a slow query, a small connection pool) and try to find it using only the tests and monitoring.
- Formalize what you've learned. ISTQB's CT-PT certification organizes all these concepts. You can practice with our CT-PT simulator and review with the ISTQB study material.
Frequently asked questions
What's the difference between a load test and a stress test?
A load test checks that the system works well under the expected load. A stress test takes it beyond that load to find the limit, see what breaks first and how it recovers. The first answers "is it enough?"; the second, "how far can it go and how does it fail?".
Do I need to know how to code to do performance testing?
To get started, no: JMeter lets you build tests with its GUI. But as you progress, knowing how to code will help a lot, both for writing complex scenarios and for understanding how the system behaves. Tools such as k6 or Locust require basic JavaScript or Python.
How many users should I simulate?
As many as your goals require. For a load test, the expected number at peak usage, ideally based on real production data. For a stress test, considerably more, until you find the limit. There's no universal number: it depends on the business.
Can I run performance tests in production?
It's possible, and some companies do it during low-traffic hours and with great care, because it's the only way to test the real infrastructure. But it has obvious risks: affecting real users, generating fake data or driving up costs. It requires planning, approval and a plan to stop the test immediately. In most cases, the recommendation is an environment as close to production as possible.
JMeter or k6?
Both are excellent. JMeter has a longer track record, a GUI, support for many protocols and high demand on the job market. k6 is more modern, lightweight and convenient for teams that work with code and pipelines. If you have the time, learning both opens more doors.
Conclusion
Performance and stress tests answer questions no functional test can: how much the system can take, how fast it responds when it's needed most, where its limit is and what happens when it goes past it. They're the difference between a successful launch and an outage at the worst possible moment.
It isn't just about the tool. It's about defining clear goals, designing realistic scenarios, preparing good data, monitoring the system, interpreting results with judgment and repeating the cycle. The tool generates the load; the analysis is up to you.
If you want to keep learning, join the QARMY WhatsApp channel, where we share news and resources and announce upcoming courses. And if you've already run stress tests, tell us what broke first: there's always a good story behind it.